16 February 2007

Mucking around with RAC and FCF

I've been exploring the use of RAC and our Fast Connection Failover (FCF) recently.

After some hiccups related to using incompatible versions, I now have it working.

*** If you are looking to test out RAC, I can thoroughly recommend downloading the Oracle Database 10gR2 RAC VMware images we have on OTN ***

*** I also recommend reading this RAC/FCF tech note put out by Oracle's very own Senor Castro ***

It's great to see it in operation, where you bring down a database instance and observe the connection pool automatically cleaning up the connections that were pointing at the instance. The load-balancing across the instances is also pretty cool to watch.

One thing I found, as I was hitching it all up, was that running the ONSTest utility (published on OTN) in receive mode was helpful to observe the ONS (Oracle Notification Service) that are being sent by the app server and the database. Particularly as an instance is taken up or down on the database service, you see the database send a notification of the action.

** HA event received -- Printing header:
Notification Type: database/event/service
Affected Components: null
Affected Nodes: null
Delivery Time: 1171580840859
Generating Component: database/rac/service
Generating Node: raclinux1.us.oracle.com
Generating Process: raclinux1.us.oracle.com:21131
Notification ID: raclinux1.us.oracle.com:2113104
Notification Creation Time:1171583159
Cluster ID: databaseClusterId
Cluster Name: databaseClusterName
Instance ID: databaseInstanceId
Instance Name: databaseInstanceName
Local Only Flag: FALSE
Body: [B@1546e25
** Body length = 95
** Event type = database/event/service
** About to generate Body Block **
The event body contains the following key/value pairs:
Key: VERSION = 1.0
Key: service = RACDB
Key: instance = RACDB1
Key: database = RACDB
Key: host = raclinux1
Key: status = down
Key: reason = user

The app server also sends out regular ONS notifications which should be visible.

** HA event received -- Printing header:
Notification Type: IAS/PM/PROC_READY
Affected Components: null
Affected Nodes: null
Delivery Time: 1171580868171
Generating Component: IAS/OC4J
Generating Node: duraace
Generating Process: 1171503227656
Notification ID: 117150322765632626
Notification Creation Time:1171580868171
Cluster ID: 1
Cluster Name: default
Instance ID: j2ee.duraace.au.oracle.com
Instance Name: j2ee.duraace.au.oracle.com
Local Only Flag: FALSE
PROPERTY ==> GenNum = -1022827834
PROPERTY ==> OPMN_UID = 1934495451
PROPERTY ==> OPMFirst = false
Once you start seeing these combined notifications from the ONSTest utility, then you know you have it wired up together correctly and you're well down the track.

The only thing remaining from there is to configure the connection-pool to use the appropriate URL for RAC access and to enable fastConnectionFailover and implicitConnectionCaching. Here's an example entry for data-sources.xml that points to the RAC database.
<managed-data-source connection-pool-name="RACDB"
jndi-name="jdbc/RACDS"
name="RACDS"/>
<connection-pool name="RACDB"
initial-limit="10"
max-connections="30"
min-connections="5">
<connection-factory
factory-class="oracle.jdbc.pool.OracleDataSource"
user="system" password="oracle"
url="jdbc:oracle:thin:@
(DESCRIPTION=
(LOAD_BALANCE=ON)
(ADDRESS=
(PROTOCOL=TCP)
(HOST=192.168.203.11)
(PORT=1521))
(ADDRESS=
(PROTOCOL=TCP)
(HOST=192.168.203.111)
(PORT=1521))
(CONNECT_DATA=
(SERVICE_NAME= RACDB)))">
<property name="connectionCachingEnabled" value="true"/>
<property name="fastConnectionFailoverEnabled" value="true"/>
</connection-factory>
</connection-pool>
Once you have that all done , you can then enable JDBC logging (that needs another blog on its on right) and view the handler activity when an instance is taken down.

Below is a truncated and modified for readability sample of the log output.
OracleFailoverEventHandlerThread.handleEvent():<database/event/service>
oracle.jdbc.pool.OracleConnectionCacheManager verifyAndHandleEvent
eventBody=
<VERSION=1.0
service=RACDB
instance=RACDB1
database=RACDB
host=raclinux1
status=down
reason=user>
oracle.jdbc.pool.OracleImplicitConnectionCache processFailoverEvent
OracleImplicitConnectionCache.processFailoverEvent(
eventType=256,
instName=RACDB1,
dbUniqName=RACDB,
hostName=raclinux1,
status=down,
card=0)
oracle.jdbc.pool.OracleImplicitConnectionCache markDownLostConnections
OracleImplicitConnectionCache.markDownLostConnections(
serviceDownEvent=true
hostDownEvent=false,
instName=RACDB1,
dbUniqName=RACDB,
hostName=raclinux1,
status=down)
oracle.jdbc.pool.OracleImplicitConnectionCache cleanupFailoverConnections
OracleImplicitConnectionCache.cleanupFailoverConnections(
serviceDownEvent=true
hostDownEvent=false,
instName=RACDB1,
dbUniqName=RACDB,
hostName=raclinux1,status=down)
oracle.jdbc.pool.OracleImplicitConnectionCache doForEveryCachedConnection
oracle.jdbc.pool.OracleImplicitConnectionCache performPooledConnectionTask
oracle.jdbc.pool.OracleImplicitConnectionCache closeAndRemovePooledConnection

14 February 2007

DMS code sample

The EAR file with the src is here.

As I mentioned, here's an example of a DMS instrumented servlet I used as an demo recently.
The simple servlet processes the request and depending on the type of request received, sleeps for a specific amount of time. Basically, if you request a vegetable it takes 5000 msecs, if you request some fruit it takes 2000 msecs.

Where it is a little more interesting is where the DMS API is used to measure the different timing points.
The DMS PhaseEvent class is used to create different items to be measured and exposed in specified ways.

For example, to set up a metric to measure some stats related to processing of a vegetable request, the following is used:

Noun base = Noun.create(SERIES_NAME);
Noun root = Noun.create(base, "eating", "eatingseries");

vegetableComp = PhaseEvent.create(root, VEGETABLE_NAME, "Time taken to eat veggies");
vegetableComp.deriveMetric(Sensor.time);
vegetableComp.deriveMetric(Sensor.average);
vegetableComp.deriveMetric(Sensor.completed);
vegetableComp.deriveMetric(Sensor.maxActive);

fruitComp = PhaseEvent.create(root, FRUIT_NAME, "Time taken to eat fruit");
fruitComp.deriveMetric(Sensor.time);
fruitComp.deriveMetric(Sensor.average);
fruitComp.deriveMetric(Sensor.completed);
fruitComp.deriveMetric(Sensor.maxActive);

This will expose an event struicture that measures the specified attributes: total time, average time, complete and max time taken for the case where a vegetable or a piece of fruit is eaten.

In the servlet, the corresponding PhasEvent is used to measure the requested action type:
if (action.equalsIgnoreCase(VEGETABLE_NAME)) {
try {
out.println("<p>");
out.println(VEGETABLE_NAME + " start ... ");
out.flush();
long now = System.currentTimeMillis();
dmsToken = vegetableComp.start();
Thread.sleep(VEGETABLE_PAUSE);
vegetableComp.stop(dmsToken);
stopped = true;
out.println("stop (" + (System.currentTimeMillis() - now) + ")");
out.println("</p>");
out.flush();
} catch (Exception e) {
// nada
} finally {
if (!stopped) {
vegetableComp.abort(dmsToken);
}
}
} else if (action.equalsIgnoreCase(FRUIT_NAME)) {
...
}
The servlet finishes off by using the DMSConsole class to render the current set of DMS stats available to the runtime:
out.println("<h3>DMSConsole</h3>");
DMSConsole.getConsole().dump(out, SERIES_NAME);

When the servlet is accessed it looks like this:


Note how the DMS metrics for the different types of tasks are shown, and expose the relevant details to show how the task is performing.

The DMS stats can also be viewed with the Spy application that ships as part of OC4J -- http://localhost:8888/dms0/Spy

Observe how the eatingseries metrics are listed amongst the rest of the OC4J metrics and correspond to what we are seeing from the direct use of DMSConsole when viewed in text mode.


And nicely, see how the metric definitions we provided are shown on the help page.


Monitor JMX instrumented applications with Grid Control

One of the nice things about working in a large company is that you sometimes come across something related to an area you work on, but which you had no idea was being developed.

For example, I learnt today that Grid Control now has functionality that enables it to monitor JMX instrumented applications, generate reports and even create alerts when thresholds are exceeded.

Here's an OBE (Oracle-By-Example) that shows how it works:

http://www.oracle.com/technology/obe/obe10gemgc_10202/jmx/jmx.htm

12 February 2007

DMS == Dynamic Monitoring System

For several releases now, OC4J (and the broader application server in general) have been utilizing some home grown technology to capture and publish runtime metrics, to present as runtime performance indicators.
 
The system we use is called DMS (Dynamic Monitoring System).  DMS itself is a highly optimized framework for gathering and collating metrics.  From the OC4J perspective, we've basically instrumented the J2EE container at all the interesting junction points to enable the runtime performance of the container to be measured.  We've also instrumented various places where deployed applications are called, enabling data to be gathered on how a deployed application is operating on the container.
 
The full set of DMS stats that we (OC4J) gather and expose can be seen in the Oracle Application Server Performance Guide -- http://download-west.oracle.com/docs/cd/B31017_01/core.1013/b28942/metrics2.htm#sthref1086.  Worth observing from this is that to we use the DMS stats where applicable, to automatically populate the JSR77 stats set.  The data you see in a JSR77 stat is the same as what you'll see in the corresponding DMS stat.
 
One further interesting aspect of DMS is that we expose it as an API that application developers can use to instrument their own applications, and have the runtime gather the stats and present them as part of the standard interface/tools.
 
The chapter from the documentation that discussed how to instument applications is here -- http://download-west.oracle.com/docs/cd/B31017_01/core.1013/b28942/dms_app.htm#sthref671
 
 
I have a semi-complete, simple example of using the DMS API to instrument an application.  When I get a chance to complete it, I'll post it here as an example, along with a few screen shots showing the application stats as they appear in the monitoring applications.

09 February 2007

Tug the Groovy Dude

My work buddy Tug is a zealot for all things scripting. He just loves Groovy and its compadre Grails.

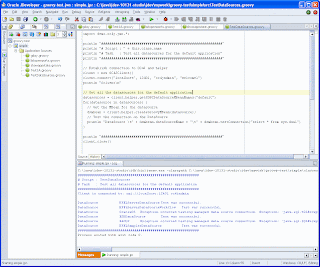
He's just posted his first effort at adding support for Groovy to Oracle JDeveloper as a downloadable extension.

Check it out @ http://groovy.codehaus.org/Oracle+JDeveloper+Plugin

I just tried it myself and it makes creating and running Groovy scripts DEAD simple. Create a new Groovy Script file, script to your hearts content, then just click the big red Run button to execute it. Could it be simpler? Mate, well done!

So with the work we'd done a while back about using the GroovyMBean andthe OC4J MBeans set to create management scripts, I thought I'd give it a shot.

I added to the Groovy project, the library to I use to connect to OC4J (that in turn uses JSR160) and the admin_client.jar library from the OC4J distribution.

I then created a little Groovy script that connects to an OC4J instance and access an OC4J MBean to see if it'd work.

Clicked the Run button and BAM! It just plain worked. JDeveloper runs the script which accesses OC4J and uses its MBeans.

How schmick is that -- use JDeveloper to write management scripts for OC4J using the Groovy scripting language and OC4J MBeans.

Tug, you're now my legend of the day. Just for today, not tomorrow. :-)

08 February 2007

OPMN event-scripts

A nifty little feature of OPMN is the ability it has to launch scripts at certain points in its management of processes -- pre-start, pre-stop and post-crash -- giving you the ability to perform any sort of management tasks that may be needed when these events are occuring

The scripts are configured per process-type, and no suprises here, I've looked at it with respect to OC4J.

Here's how you configure it in an opmn.xml file:
  <process-type id="home" module-id="OC4J" status="enabled">
<module-data>
<category id="start-parameters">
<data id="java-options" value="-Xrs ..."/>
</category>
<category id="stop-parameters">
<data id="java-options" value="..."/>
</category>
</module-data>
<event-scripts>
<pre-start path="c:\\temp\\pre-start.bat"/>
<pre-stop path="c:\\temp\\pre-stop.bat"/>
</event-scripts>
<start timeout="600" retry="2"/>
<stop timeout="120"/>
<restart timeout="720" retry="2"/>
<port id="default-web-site" range="80-100" protocol="http"/>
<port id="rmi" range="12401-12500"/>
<port id="rmis" range="12701-12800"/>
<port id="jms" range="12601-12700"/>
<process-set id="default_group" numprocs="1"/>
</process-type>
The scripts are passed a set of arguments that provide information about the current environment such as the timestamp, the OC4J instance name and group, etc.

This is covered in more detail in Chapter 3 of the OPMN Administrators Guide.


Firefox visits outrank Internet Exploder

I don't get a lot of traffic so its not a large sample size, but I just noticed that there are more visits here from Firefox than Internet Exploder!


Or maybe this just means I read my own blog a lot for stuff that I forget, but need to use from time to time ... :-)

Using javax.sql.rowset.CachedRowSet for Web app pagination?

I've been trying to use the javax.sql.rowset.CachedRowSet (com.sun.rowset.CachedRowSetImpl) as a way to implement simple pagination for a web application. 
 
My reasoning was that the CachedRowSet supports a page model whereby a specific number of rows can be retrieved from a query (ie pages!) and a CachedRowSet is disconnected and serializable so it can be stored in a HttpSession between user requests so the page state can be maintained easily for each user.
 
 
Because a CachedRowSet object stores data in memory, the amount of data that it can contain at any one time is determined by the amount of memory available. To get around this limitation, a CachedRowSet object can retrieve data from a ResultSet object in chunks of data, called pages. To take advantage of this mechanism, an application sets the number of rows to be included in a page using the method setPageSize. In other words, if the page size is set to five, a chunk of five rows of data will be fetched from the data source at one time. An application can also optionally set the maximum number of rows that may be fetched at one time.
 
Therefore to provide a simple approach to doing pagination, I was thinking that I could create a CachedRowSet for a user, give it a query and set the page size to specify how many rows of data I wanted to fetch/display at a time.  Since the CachedRowSet is disconnected and serialiable, it is stored in the HttpSession and retrieved on the next request, where the nextPage() method is called to fetch the next set of rows.
 
Pseudo code:
    if is a new request
      create CachedRowSet
      set query
      set page size
      execute
    else
      CachedRowSet nextPage()

    display data from CachedRowSet
    store CachedRowSet in HttpSession
 
A quick app showed that it worked and on each request, the next page of data was displayed (I haven't actually yet looked at the database traces to determine if only 5 rows are really being returned, but lets assume it is).
 
What I then wanted to add was simple [Next] and [Prev] links to allow the user to navigate backwards and forwards through the pages of data.
 
Looking at the nextPage() method, the Javadoc (http://java.sun.com/j2se/1.5.0/docs/api/javax/sql/rowset/CachedRowSet.html#nextPage()) says:
 
boolean nextPage() ...
 
Increments the current page of the CachedRowSet. This causes the CachedRowSet implementation to fetch the next page-size rows and populate the RowSet, if remaining rows remain within scope of the original SQL query used to populated the RowSet.
 
Returns:
true if more pages exist; false if this is the last page
 
So, I thought I'd be able to use this so that when the user hits the last page of data, the nextPage() method should return false, which can then be used to determine if the [Next] link should be shown:
 
    ...
    else
      hasNext = CachedRowSet nextPage()
    if hasNext addNextLink
    display data from CachedRowSet
    store CachedRowSet in HttpSession
 
What I'm finding though is that when the CachedRowSet is on the last page of data, the nextPage() method is stil returning false, and I can pass over the end of the dataset and get an exception.
 
    if(direction == null) {
        // just show the current page set
        crs.beforeFirst();   
    } else if (direction.equalsIgnoreCase("next")) {
        // should return false when on the last page
        hasNextPage = crs.nextPage();
        crs.beforeFirst();
        System.out.println("Called next : " + hasNextPage);                   
        hasPrevPage = true;
    } else if (direction.equalsIgnoreCase("prev")){
        // should return false when on the first page
        hasPrevPage = crs.previousPage();
        crs.beforeFirst();
        System.out.println("prev:" + hasPrevPage);                   
        hasNextPage = true;
    }
Has anyone else used a CachedRowSet like this?  Interested to hear if I'm being a fool or if this is a known problem.
 
I'll put the code somewhere on the blog-o-sphere in case I'm missing something or just being a fool :-)


06 February 2007

Specifying OC4J standalone ports from the command line

We get asked from time to time whether its possible to specify the port values for OC4J standalone to use when it is started, instead of using what's in the configuration files.

The answer is yes but it's nothing you'll find documented anywhere I've seen.

Typically the ports used by OC4J are defined in the various configuration files that reside in the j2ee/home/config directory.

RMI(S): rmi.xml
JMS: jms.xml
HTTP: default-web-site.xml

Any or all of these port values can be overridden when OC4J is started by supplying an additional startup string that looks like this:

>java -jar oc4j.jar -properties -ports default-web-site:http:80,rmi:1200,rmis:1201,jms:1202

Note: this mechanism is for the 10.1.3 release.

The string basically specifies the "protocol" and the "port" to use for the protocol. The slight variance is with default-web-site:http: entry. This is because there can be multiple web-sites for an OC4J instance, so the id/name of the web-site is needed.

>java -jar oc4j.jar -properties -ports default-web-site:http:5550,rmi:5551,rmis:5552,jms:5553

>netstat -a | grep 555
TCP sbutton-au:5550 sbutton-au:0 LISTENING
TCP sbutton-au:5551 sbutton-au:0 LISTENING
TCP sbutton-au:5552 sbutton-au:0 LISTENING
TCP sbutton-au:5553 sbutton-au:0 LISTENING